Graphs and stuff
Graph Basics
|
Graphs are used to visualize data. Sometimes it is easier to understand data when it is visualized in a graph.
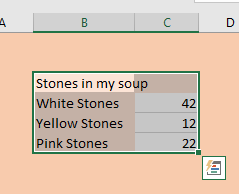
The most important thing to remember when creating a graph in Excel is that all the sides are labelled To create a graph in Excel you simply highlight the data and click "insert graph" Task: Open "7-Graphs and stuff" and complete basic graphs. Different types of data are better represented through different types of graphs as seen below. |
|
Bar Graph
|
On the right you will see a video of a Bar Graph.
Bar graphs are very useful at showing comparisons of amounts when they are not part of a set. Task: Create a labelled bar graph based on the information on DBZ fighters on the Bar Tab. |
|
Pie Graph
|
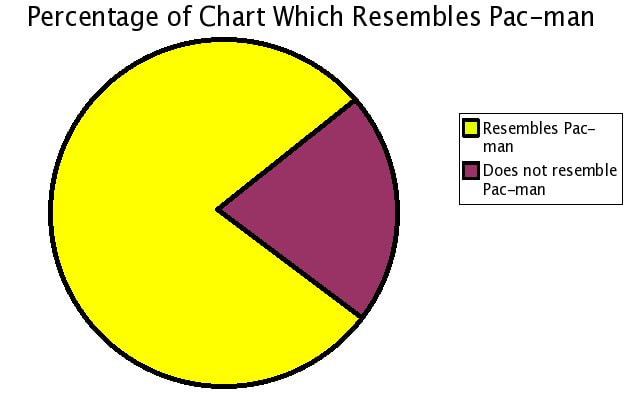
Pie graphs are useful when you are trying to visualize data that is part of a whole
For example what percentage of skittles in each packet are red? Task: Create 2 Pie graphs based on the worst fruit bursts and the best fruit bursts. Colour the individual slices to match the fruit bursts. Make sure you label it with percentages. |
|
Line Graph
|
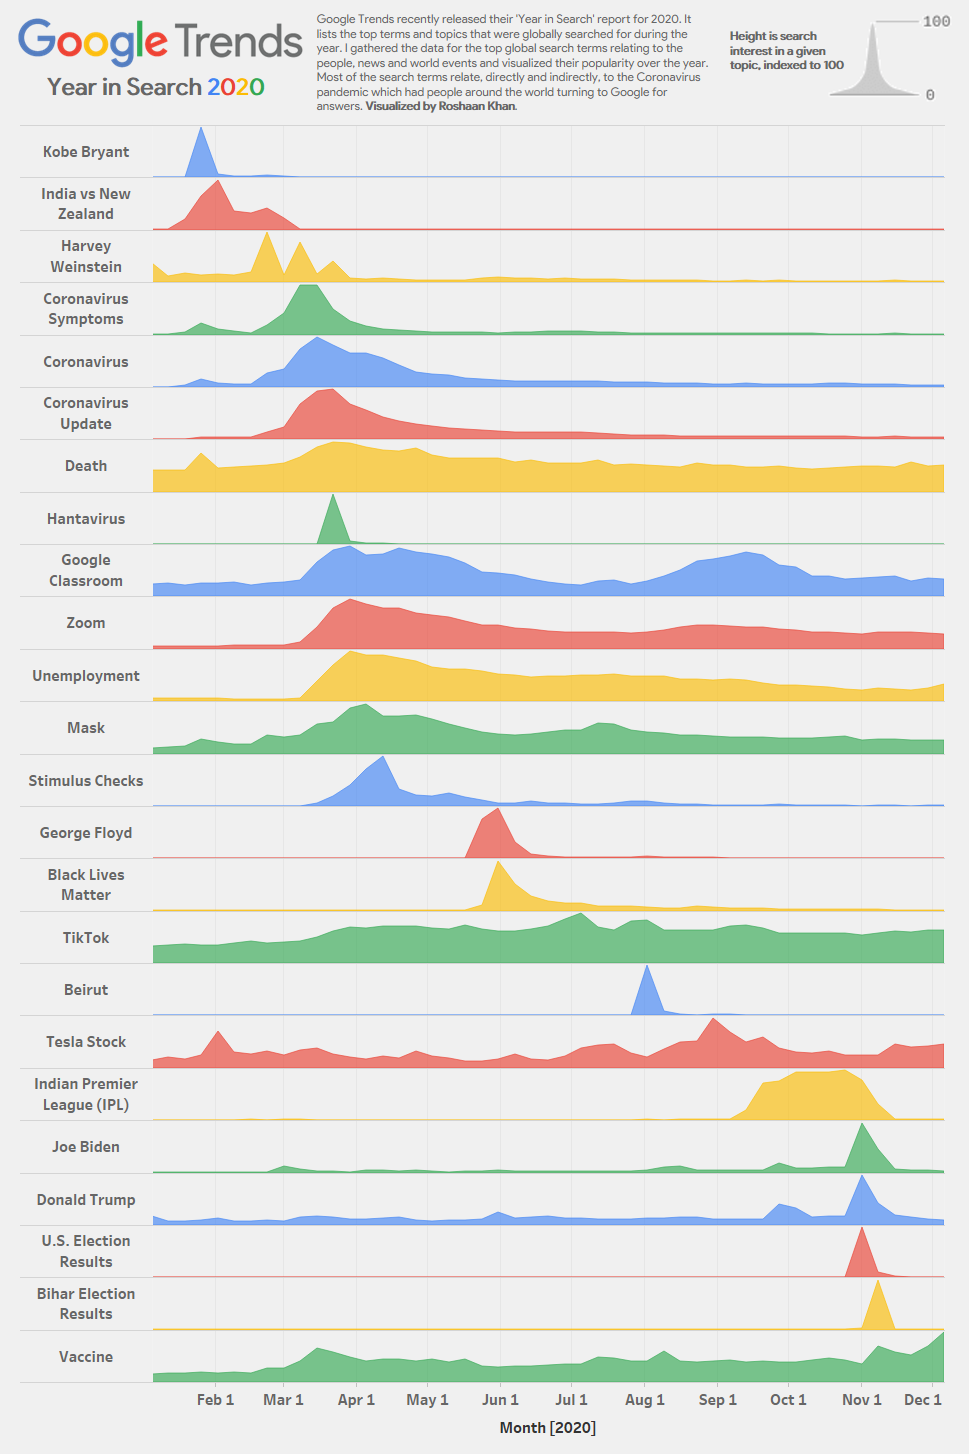
Line graphs are good for representing changes over time.
On the right you see a bunch of different line graphs for google searches. The key to knowing whether you need a line graph is whether it is a change over time. Task: Create a line graph on the line graph pepsi tab. |
|
